FlyBase:Interaction Browser
The Interactions Browser allows one to visually explore the genetic and physical interaction data recorded in the Interactions section of the gene report, as well as the allele-specific data recorded in the Interactions section of the allele report. You can find this tool under the 'Tools' menu, in the Physical Interactions report, or in the Genetic Interactions sections of a gene or an allele report.
The Interactions Diagram
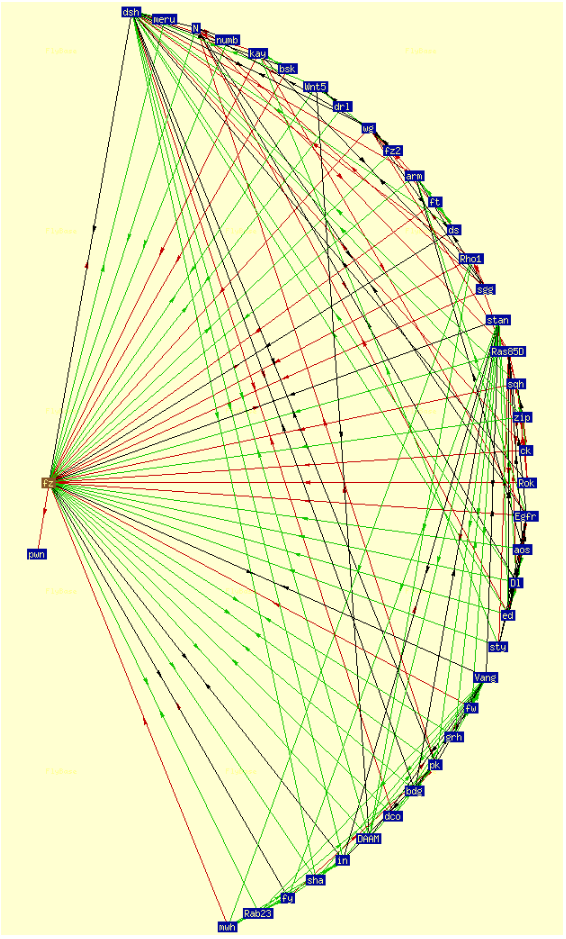
In both the gene and allele interaction networks the query itself is shown in brown, and the genes or alleles that directly interact with the query are shown in dark blue. The genes and alleles that interact with the directly interacting ones (i.e., two steps away from the query node) are shown in light blue. Lines connecting nodes are colored to represent enhancement (green) or suppression (red) or both (black). The arrow’s direction shows the direction of the interaction: e.g., A ---> B means that gene A enhances/suppresses gene B.
Each node of the interaction diagram has a pop-up window which allows you to explore the interaction data of that particular node. For an allele diagram, the pop-up windows show the specific genetic interaction of alleles that has been reported. For a gene diagram the pop-up windows show information about the gene.
Please note: A diagram drawn for a gene is based on the data of all alleles of a gene, which may include antimorphic and neomorphic alleles, so it should be interpreted with care.
Options
Gene/Allele Symbol or FBid
The tool accepts a FlyBase gene or allele ID, and valid gene symbols (e.g. "fz") or allele symbols (e.g. "fz[15]", where the allele superscript is placed in square brackets). Please note, the search box is case sensitive, so it is important to enter "dpp" rather than "Dpp".
Interaction Type
You can choose to display the data on enhancers, suppressors or both categories of genetic interactions. Alternatively, you can display physical interactions for that gene.
Scan Depth
The complexity of the diagrams can be regulated by altering the scan depth. ‘Auto’ is a function that will draw a diagram showing the interactions several steps away from your query provided the network is not too big. However, some of these diagrams are complex so it can be useful to limit the network to one gene or allele away from your query.
Include
Alleles of genes, such as sca[Scer\UAS.cEa], and fusion genes, such as btl::Egfr[Scer\UAS.T:lambda], that have been introduced into flies are not shown by default but can be added to the diagram.
Limit to
The "Limit to" function shows you a list of the controlled vocabulary terms that have been used to annotate the interactions of the alleles of the gene, or the allele, you specified as your query. If you select one of the terms the diagram will only include interactions of the alleles of your query which have been annotated with the term. Thus, for example if you enter the gene symbol "dpp" and choose eye in the "Limit to" box, and then click on the "Show Interactions" button to update the diagram, you will see a picture showing the genes which have an allele that interacts with a dpp allele to alter an eye phenotype.
Degrees rotation
This select box allows you to redraw the picture at a different angle to improve the layout of the network on the page. Choose a new angle and click on "Show Interactions" to redraw the diagram.